An enormous sign with bold red letters reads EMERGENCY, pointing the way to the local ER. A small group of police officers lean on the hood of their vehicle, all staring off in different directions. One officer is either using a walkie-talkie or eating a sandwich—the photo makes it hard to tell. There’s an orange traffic cone poking into the foreground. This was the image chosen to represent the city of Poughkeepsie on Forbes’s 2013 list of America’s Most Miserable Cities.
The caption reads:
#18
Poughkeepsie, N.Y.
Poughkeepsie residents must endure crummy weather and long commutes to work. Their average commute of 31.9 minutes is the sixth highest in the U.S. Property tax rates are also onerous.
While cities like Detroit and Chicago have repeatedly appeared on the Forbes list in previous years, 2013 marked the first year that Poughkeepsie earned the dubious distinction of being recognized as one of America’s most miserable metropolitan areas. When the Forbes list and accompanying slideshow went live in late February, town officials were, predictably, peeved.
Dutchess County Executive Mark Molinaro called up the Poughkeepsie Journal to weigh in on the ranking. In an article responding to the Most Miserable list, Molinaro said, "Forbes ought to get its story and act together because the inconsistency at best is ridiculous, and at worst, damages the image of a robust and vibrant community. If there was a methodology, it is severely flawed.”
The Forbes list methodology is based on an original Misery Index that economist Arthur Okun developed in the 1960s. While Okun quantified the misery of nations based on unemployment and inflation, Forbes’s own misery-o-meter is based on city-specific economic and social data collected by national and local governments.
Kurt Badenhausen, the Forbes reporter tasked with churning out the annual Most Miserable list, says that the magazine’s preferred misery metrics have evolved consistently over the six years that this list has been published. This year, the rankings were determined based on rates of violent crime, unemployment, foreclosures, property taxes, commute times, and weather. “We’re looking for data that’s comparable across cities,” he says. “And over the years we’ve changed the metrics to some degree.” Some past metrics, like local sports team performance, were removed for the 2013 rankings; some new metrics, like net migration, were added on. But Badenhausen stressed that the point of the list wasn’t to slam cities ruthlessly. “We’re trying to create a conversation amongst our readers,” he says.
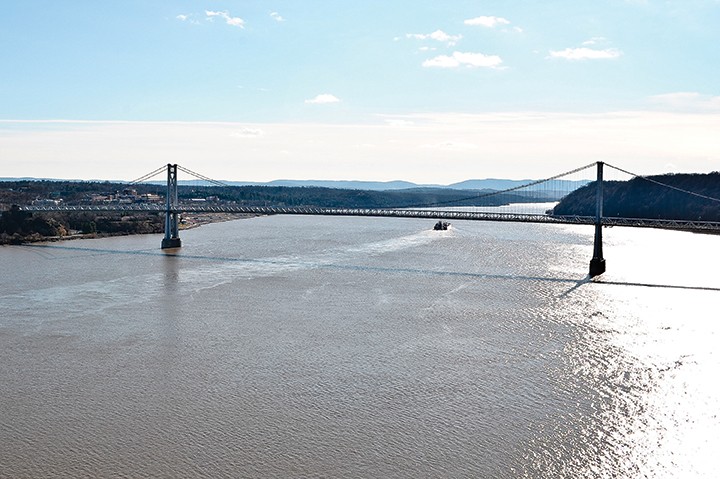
The list certainly sparked conversations in Poughkeepsie, some of which may have been surprising to the Forbes editors. For instance, regular Forbes readers couldn’t help but notice that even though Poughkeepsie was listed as a miserable city in February 2013, the very same magazine had listed Poughkeepsie as one of the country’s Best Cities for Raising a Family in April 2012, only a little over a year earlier. For that list, Poughkeepsie is represented by a photo of the gleaming Walkway Over the Hudson, accompanied by the glib, glossy caption “Costs are high, but so are incomes. And the crime rate is one of the country’s lowest.”
People in Poughkeepsie couldn’t help but wonder, what gives?
Badenhausen didn’t seem particularly fazed by the list overlap. It all comes down to the statistics you choose to look at, he explained. “It’s a question of different things being measured,” he said, comparing the metrics used for the Best Cities for Raising a Family and Most Miserable lists. “They’re looking at housing affordability, and they’re looking at commuting too, but they’re looking at commuting delays. We looked at average commute times.”
In other words, both lists took commuting into account as a quality of life metric in some way—but one painted a positive picture of the average Poughkeepsie commute, while the other was used as an example of the area’s misery. The average Poughkeepsie resident’s commute time is 31.9 minutes, over five minutes more than the national average of 25.4 minutes. In that sense, Poughkeepsie commuters are plain miserable. But the delays faced by the average Poughkeepsie commuter are low (perhaps because many commuters take the train), which contributed to Poughkeepsie’s positive ranking on the Best Places to Raise a Family list last year. When you create a happiness or misery index for an area, each category of data you consider is going to be multifaceted. Which of those facets you choose to consider can completely transform your results.